Rshiny is a great tool in R that allows you to create web applications. Regressions were one of the first statistical methods I focused on back during my bachelors (used in both my thesis and dissertation) and remains a very popular method.
Following my dissertation study, I was running statistics for the data in my study and various other studies that I was the statistican for. So I created a few R shiny apps that allowed me to input the data, specify the parameters of importance, and display the findings for a variety of statistical models.
I made these Rshiny Apps specific for my needs, however I created a basic one below that anyone can use right away. Features of the code:
Data Input
- Allows file upload for .csv files
Model Building
- Constructs a formula using user-selected variables.
- Fits a linear model using lm.
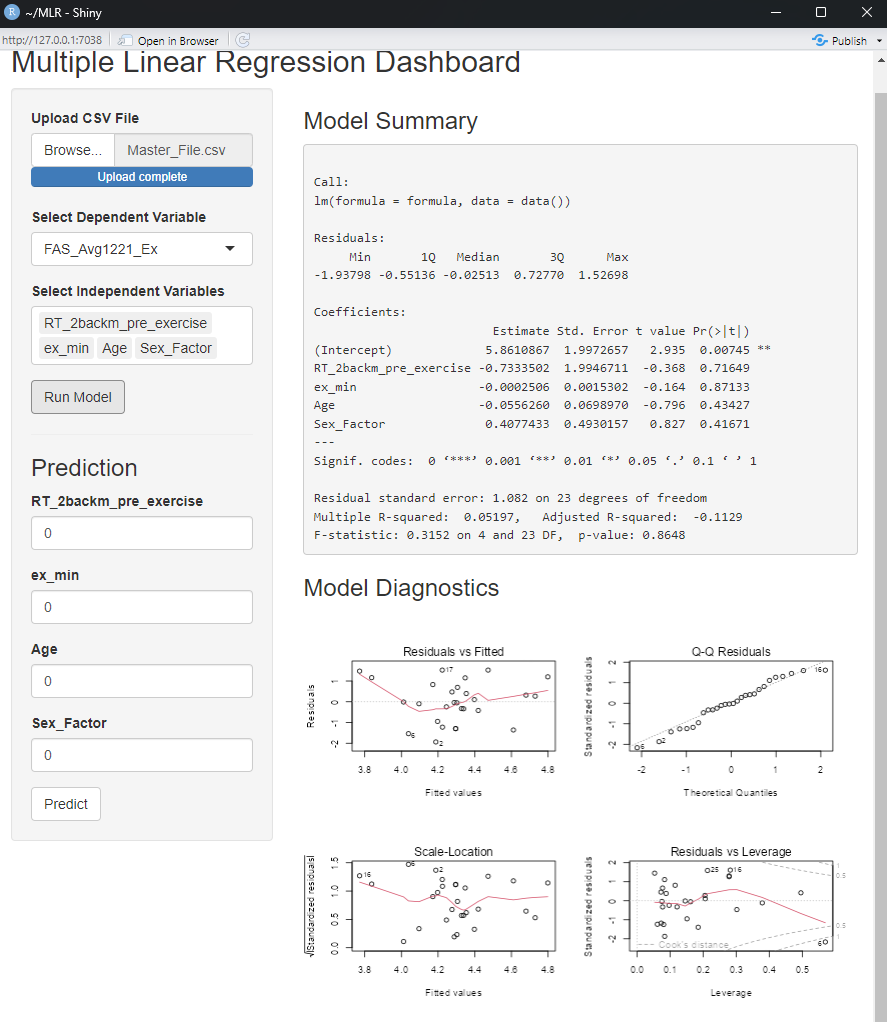
Model Outputs
- Displays the model summary and diagnostic plots.
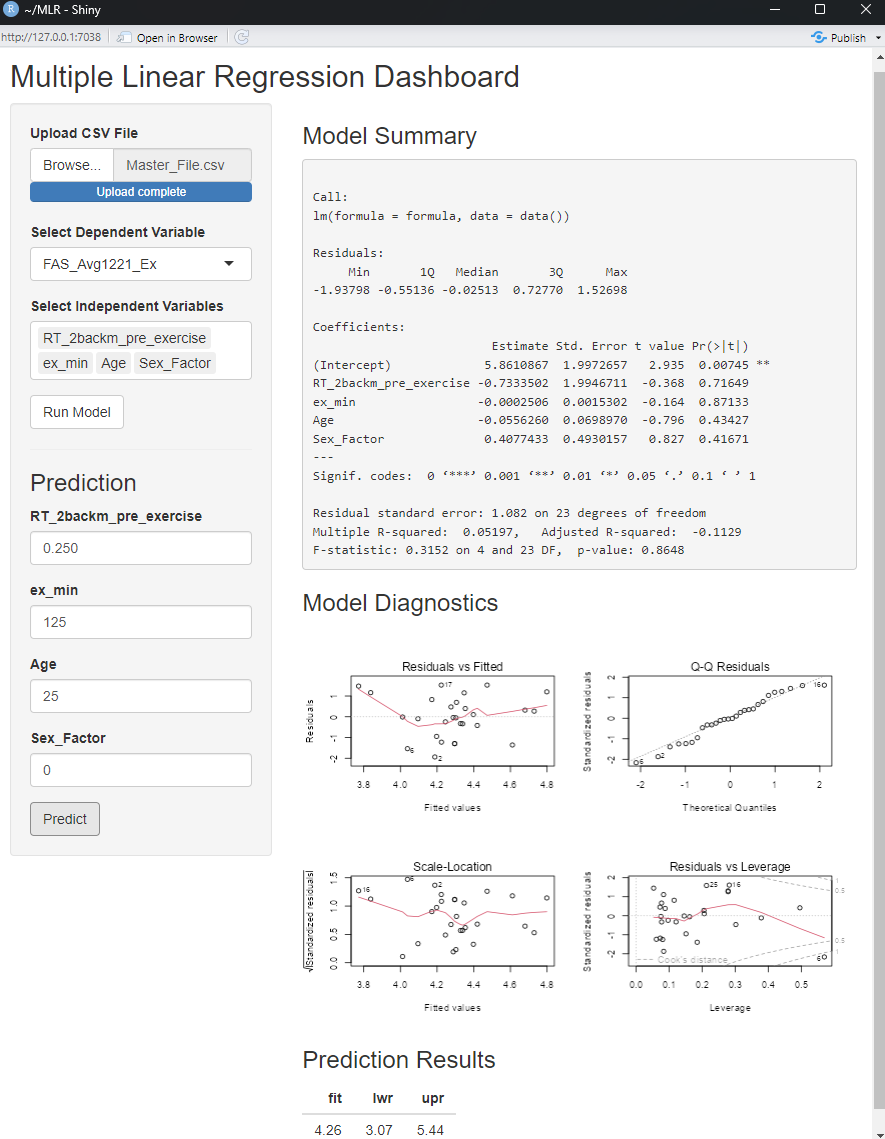
Prediction
- Dynamically generates input fields for prediction based on selected independent variables.
- Outputs predictions with confidence intervals.
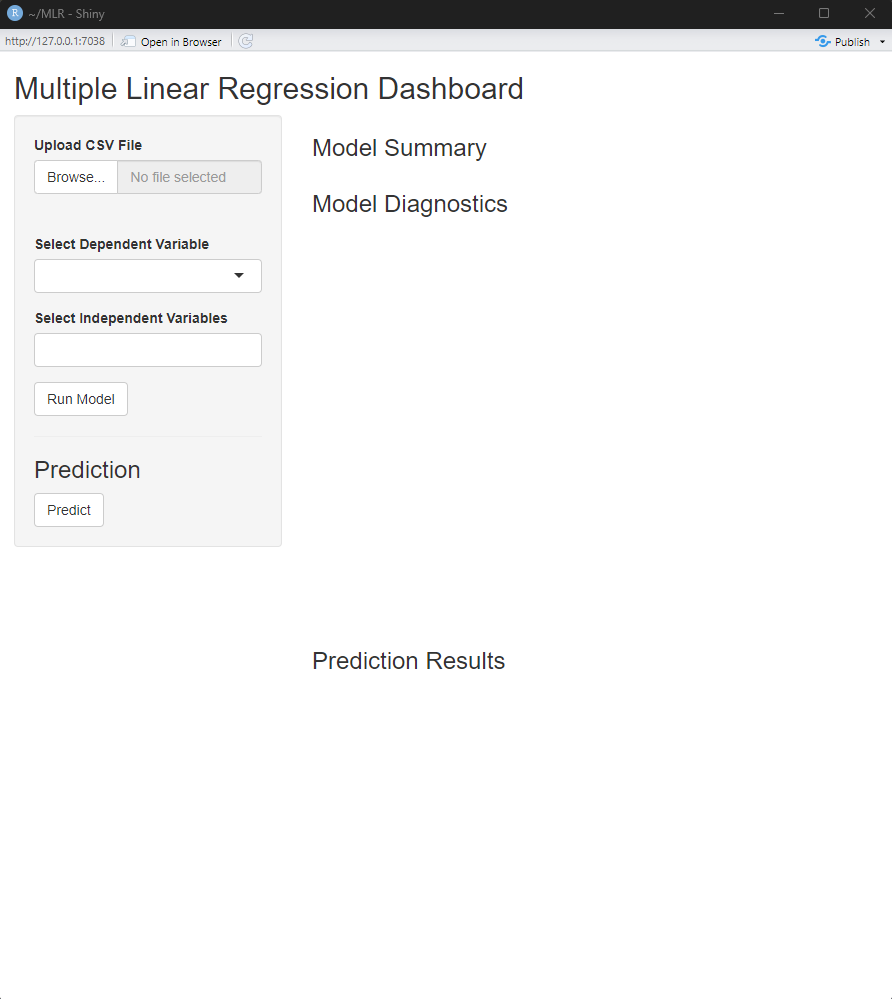
Preview
This code allows you to just run multiple regressions and review the output if that is all you’re interested in:
And if you’re interested in using the results of your regression model to make predictions on new data you can simply input the data right into the interface and it will display the predicts and CI at the bottom!
Full Code
UI (User Interface): Design interactive elements for data input, variable selection, and outputs.
library(shiny)
library(ggplot2)

ui <- fluidPage(
  titlePanel("Multiple Linear Regression Dashboard"),
  sidebarLayout(
    sidebarPanel(
      fileInput("file", "Upload CSV File", accept = ".csv"),
      selectInput("dependent", "Select Dependent Variable", choices = NULL),
      selectInput("independent", "Select Independent Variables", choices = NULL, multiple = TRUE),
      actionButton("run_model", "Run Model"),
      hr(),
      h3("Prediction"),
      uiOutput("prediction_inputs"),
      actionButton("predict", "Predict")
    ),
    mainPanel(
      h3("Model Summary"),
      verbatimTextOutput("model_summary"),
      h3("Model Diagnostics"),
      plotOutput("diagnostic_plot"),
      h3("Prediction Results"),
      tableOutput("prediction_results")
    )
  )
)
Server: Process inputs, fit the regression model, and generate outputs. Reactive Components: Dynamically update outputs based on user inputs.
server <- function(input, output, session) {
  # Reactive to load data
  data <- reactive({
    req(input$file)
    read.csv(input$file$datapath)
  })

  # Update variable selection based on uploaded data
  observe({
    req(data())
    updateSelectInput(session, "dependent", choices = names(data()))
    updateSelectInput(session, "independent", choices = names(data()))
  })

  # Reactive to build model
  model <- eventReactive(input$run_model, {
    req(input$dependent, input$independent)
    formula <- as.formula(paste(input$dependent, "~", paste(input$independent, collapse = "+")))
    lm(formula, data = data())
  })

  # Display model summary
  output$model_summary <- renderPrint({
    req(model())
    summary(model())
  })

  # Diagnostic plots
  output$diagnostic_plot <- renderPlot({
    req(model())
    par(mfrow = c(2, 2))
    plot(model())
  })

  # Generate prediction inputs dynamically
  output$prediction_inputs <- renderUI({
    req(model())
    lapply(input$independent, function(var) {
      numericInput(var, label = var, value = 0)
    })
  })

  # Predict new values
  prediction <- eventReactive(input$predict, {
    req(model())
    newdata <- as.data.frame(lapply(input$independent, function(var) input[[var]]))
    colnames(newdata) <- input$independent
    predict(model(), newdata = newdata, interval = "confidence")
  })

  output$prediction_results <- renderTable({
    req(prediction())
    as.data.frame(prediction())
  })
}

shinyApp(ui = ui, server = server)
To Run:
- Save this entire code to an app.R file
- Run it using runApp() in your R console
- Upload your dataset or test with the included features.
Happy statistical analysis!